The Tool Bar Summarize tab helps you to Generate Reports that provide the company-wide or department-level visibility you need. Premium Mobile provides both standard and custom reports. For information about custom reports, contact your representative.
Note: Some of the features available in Premium Mobile may be restricted by your administrator or your Client Settings.
To generate the reports you need, perform the following steps:
1. From the Summarize tab in your Tool Bar, click Generate Reports.

2. In the Generate Reports screen:
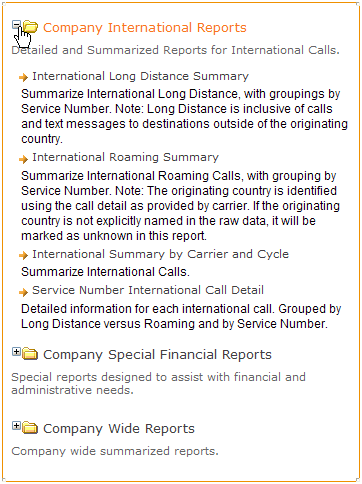
a. Click the + symbol to expand the reporting category in which you are interested.

b. Click the report link to select the report you want to generate.
c. From the drop-down list, billing cycle type.

The Invoice Cycle perspective is helpful when viewing new data just released by your carrier(s). Invoice periods run approximately 30 days in length and will include a variety of Market Cycle end dates.
Note: While the Invoice Cycle perspective may help you better understand your carrier invoices, it is very important that you continue to pay your bills based on the totals shown on the invoice your carrier sends you. Never pay an invoice based on data displayed on your wireless management Website.
The Market Cycle perspective represents a monthly grouping of all billing data with market cycle end dates that fell in the month you selected. Since invoices rarely run from the beginning of a single month to the end of that same month, it is likely that the Market Cycle perspective will not match the Invoice Cycle perspective. Carrier market cycle periods run approximately 30 days in length and have a variety of cut-off dates for billing that are market specific. The Market Cycle perspective is helpful in examining historical usage or charge data when comparing this data from month to month. This information may help you identify billing errors and instances of double billing.
d. Enter or select the period or timeframe over which you want to generate a report.
Note: Depending on your system configuration and the type of report you want to run, other drop-down lists may be available to help you refine your report output.
e. Use any other available fields to refine the information displayed in your report.
f. Click the View Report button.
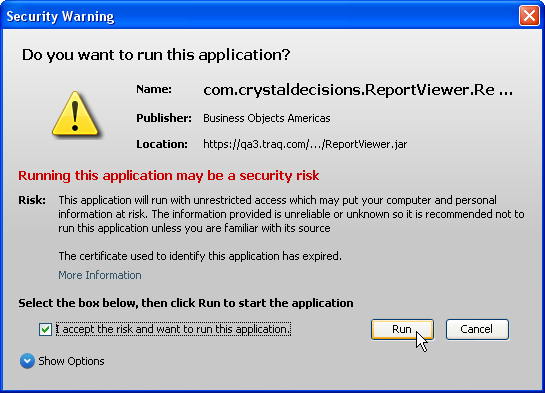
If asked to run the crystaldecisions.ReportViewer applet, click the accept checkbox and the Run button.
You may suppress future warnings by clicking Show Options and the Do not show again checkbox before you click the Run button.

Your report is generated.

Reporting tools help you to quickly locate, view, print, and export the information you need.