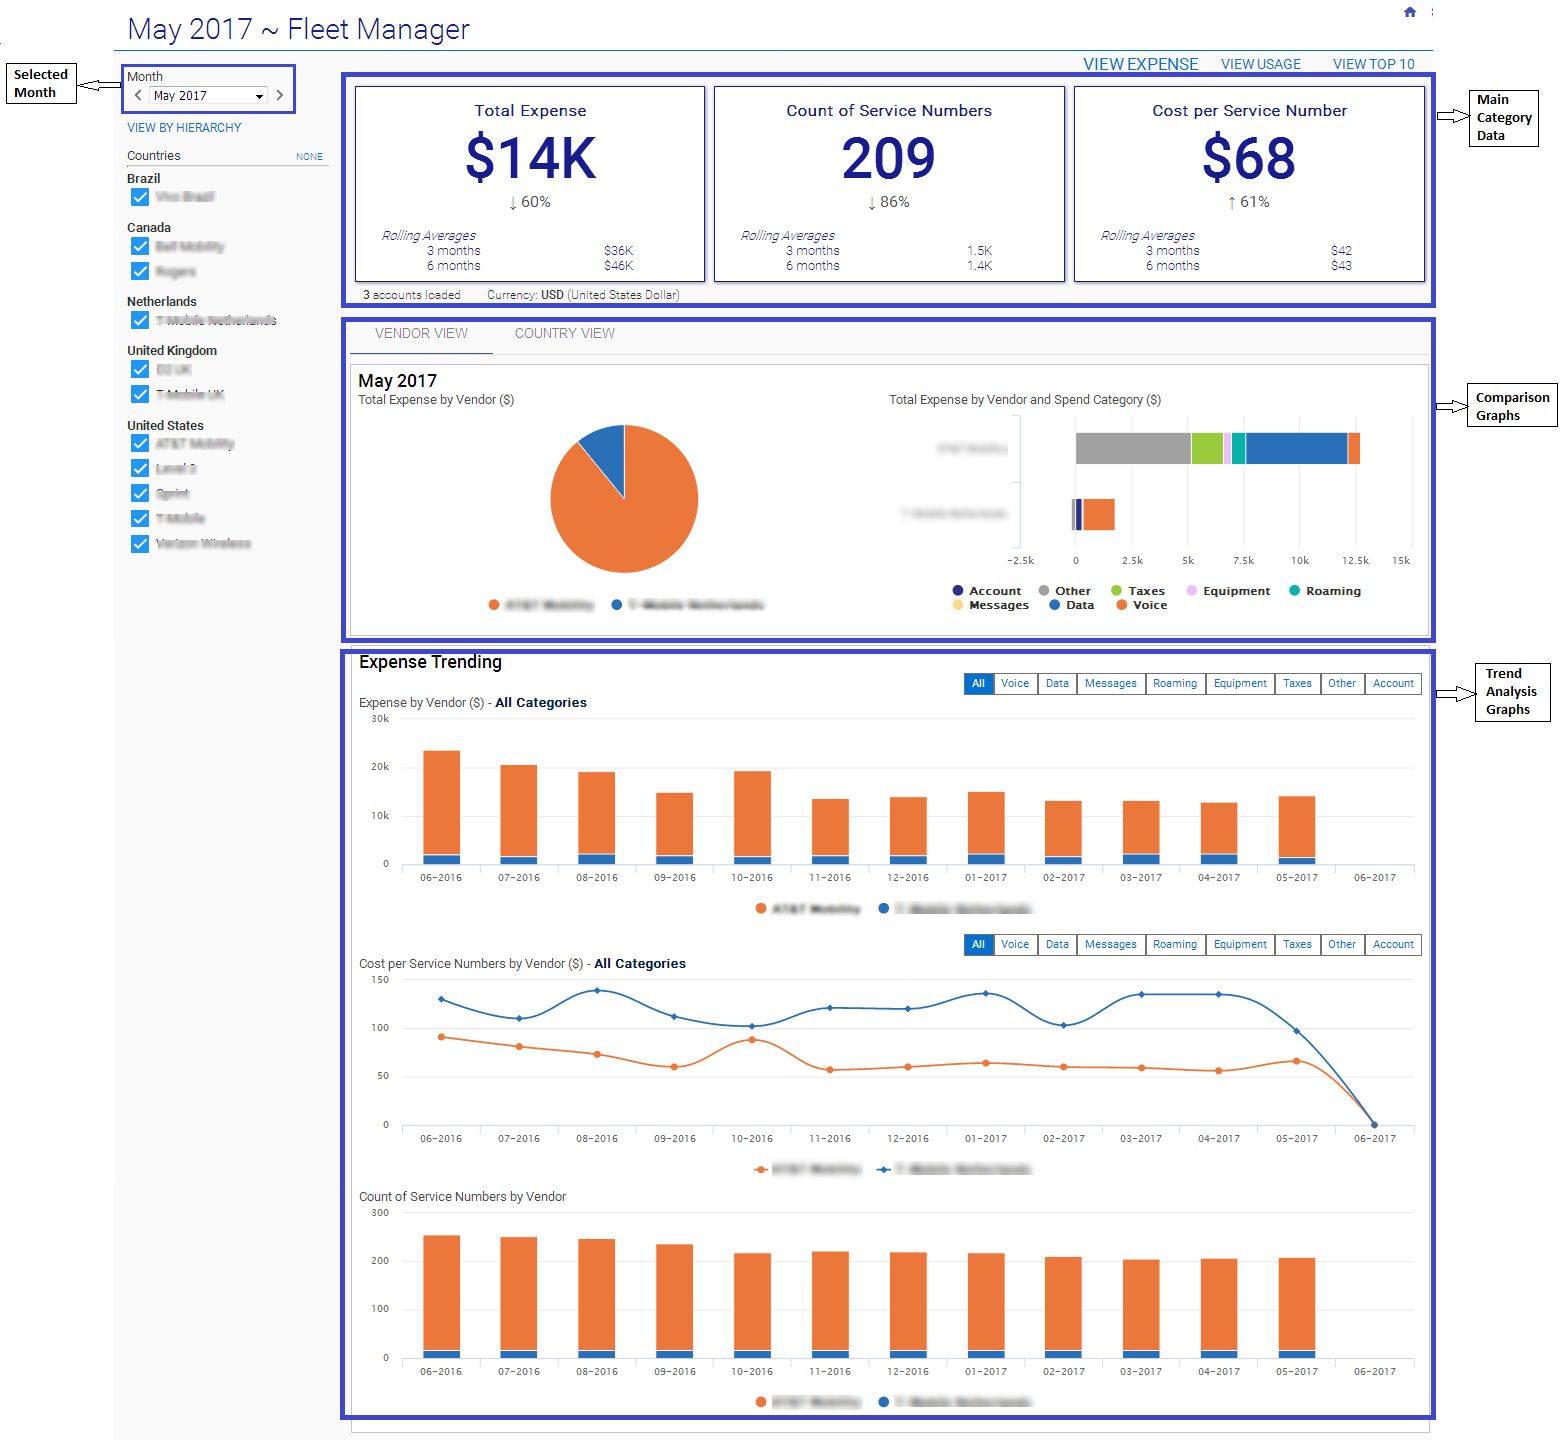
The Dashboard link, available from the Summarize tab in your Toolbar, opens the reporting dashboard. A dashboard is a collection of graphical sections that provide dynamic visualization of data. These graphs provide comparison and trend visualizations, which are used to find potential problems that may require further analysis and corrective measures.
A reporting dashboard page is divided in to three main sections:
1. Key Performance Indicator – The dashboards are generated based on Expense and Usage. This section displays the main categories for expense or usage data.
2. Comparison Graphs – This section displays a comparative graph of the current month selected. It includes a pie and a stacked bar graphs for easier comparative analysis. You can select to view the graphs either by Country or by Vendor.
3. Trend Analysis Graphs – This section display the graphs which uses the historical data to project the trend for the selected category.
Note: If the Dashboard is accessed using Internet Explorer, the Trend Analysis graphs are present as tabs on the top right hand side of the Comparison Graphs section.
You can select the Month from the drop-down list on the top right corner of the page.

Separate dashboards are generated based on Expense and Usage of a selected vendor and Cost Centre wise expense of the selected hierarchy. You can select to view one of the following tabs:
· View By Vendors
· View By Hierarchy
Note: When you navigate to the Dashboard, the View By Vendors > View Expense tab is displayed by default.
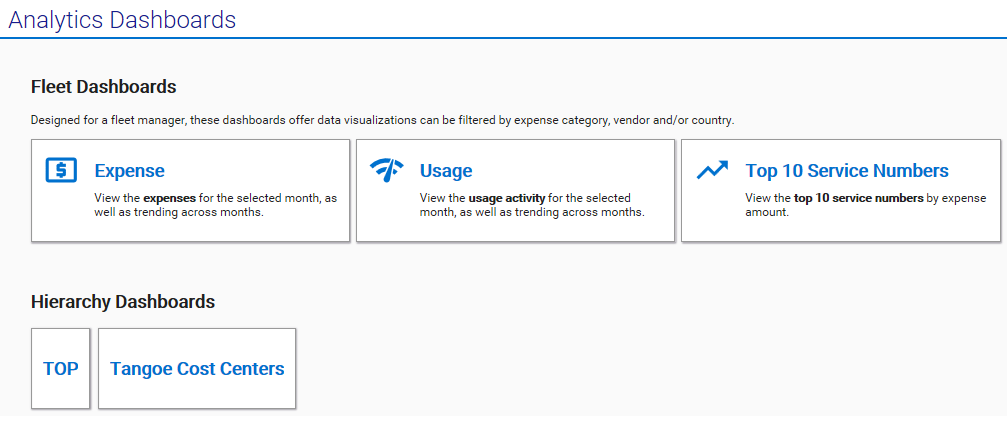
You can also navigate to different dashboards from the Analytics Dashboards home page by clicking on the home icon in the top left corner of the Dashboard page. In the Analytics Dashboards page the dashboards links are listed under the following two categories:
Fleet Dashboards - These dashboards offer data visualizations which can be filtered by expense category, vendor and/or country.
Hierarchy Dashboards - These dashboards offer data visualization of the Cost Centre expense of the selected hierarchy.

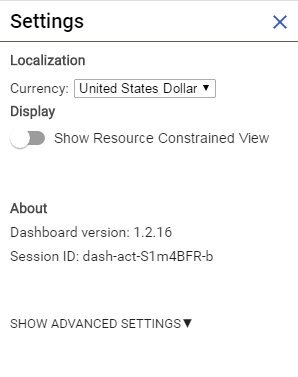
You can view the Dashboard Settings by selecting the
 icon on the top left corner of the Dashboard page. The Settings page displays
the following:
Localization - Currency - Allows the user to select the currency in which data is displayed in the dashboard. The Currency drop-down list displays only the currencies which are selected for the user profile.
Display - Show Resource Constrained View - If this option is turned on, the graphs in the dashboard display the resource constraint view only.
About - Displays the version and session details of the dashboard.
